Integration in Grafana
Prometheus
Prometheus export
Blocky can optionally export metrics for Prometheus.
Following metrics will be exported:
| name | Description |
|---|---|
| blocky_blacklist_cache / blocky_whitelist_cache | Number of entries in blacklist/whitelist cache, partitioned by group |
| blocky_error_total | Counter for internal errors |
| blocky_query_total | Number of total queries, partitioned by client and DNS request type (A, AAAA, PTR, etc) |
| blocky_request_duration_ms_bucket | Request duration histogram, partitioned by response type (Blocked, cached, etc) |
| blocky_response_total | Number of responses, partitioned by response type (Blocked, cached, etc), DNS response code, and reason |
| blocky_blocking_enabled | 1 if blocking is enabled, 0 otherwise |
| blocky_cache_entry_count | Number of entries in cache |
| blocky_cache_hit_count / blocky_cache_miss_count | Cache hit/miss counters |
| blocky_prefetch_count | Amount of prefetched DNS responses |
| blocky_prefetch_domain_name_cache_count | Amount of domain names being prefetched |
| blocky_failed_download_count | Number of failed list downloads |
Grafana dashboard
Example Grafana dashboard
definition as JSON
or at grafana.com
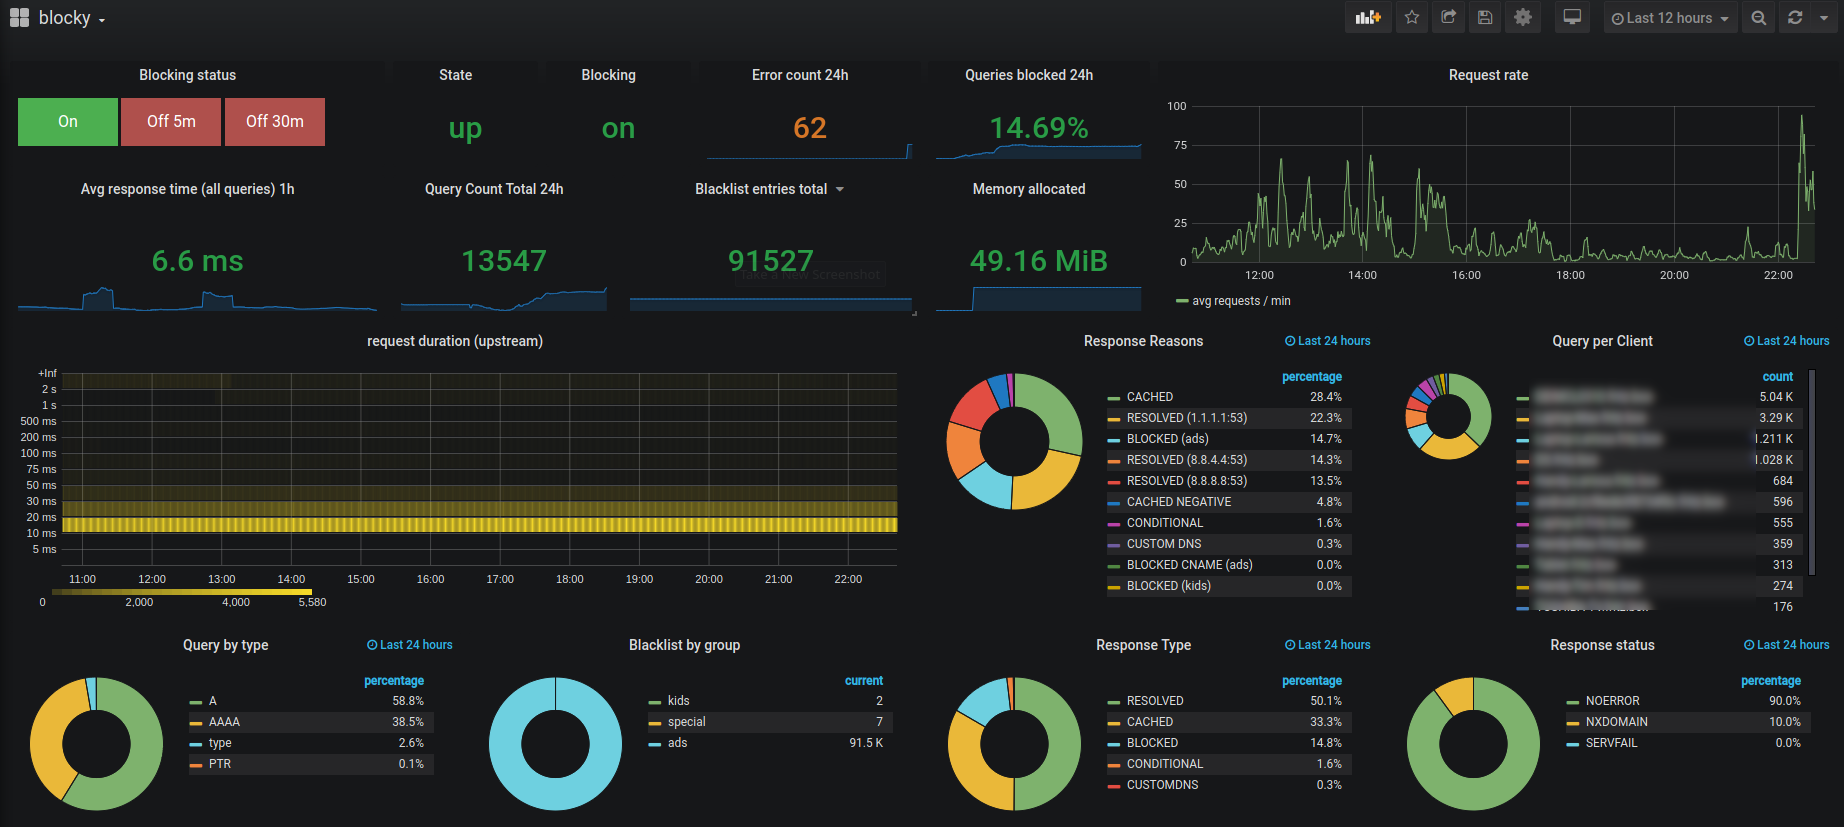 .
.
This dashboard shows all relevant statistics and allows enabling and disabling the blocking status.
Grafana configuration
Please install grafana-piechart-panel and
set disable-sanitize-html
in config or as env to use control buttons to enable/disable the blocking status.
Grafana and Prometheus example project
This repo contains example docker-compose.yml with blocky, prometheus (with configured scraper for blocky) and grafana with prometheus datasource.
MySQL / MariaDB
If database query logging is activated (see Query logging), you can use following Grafana Dashboard as JSON or at grafana.com
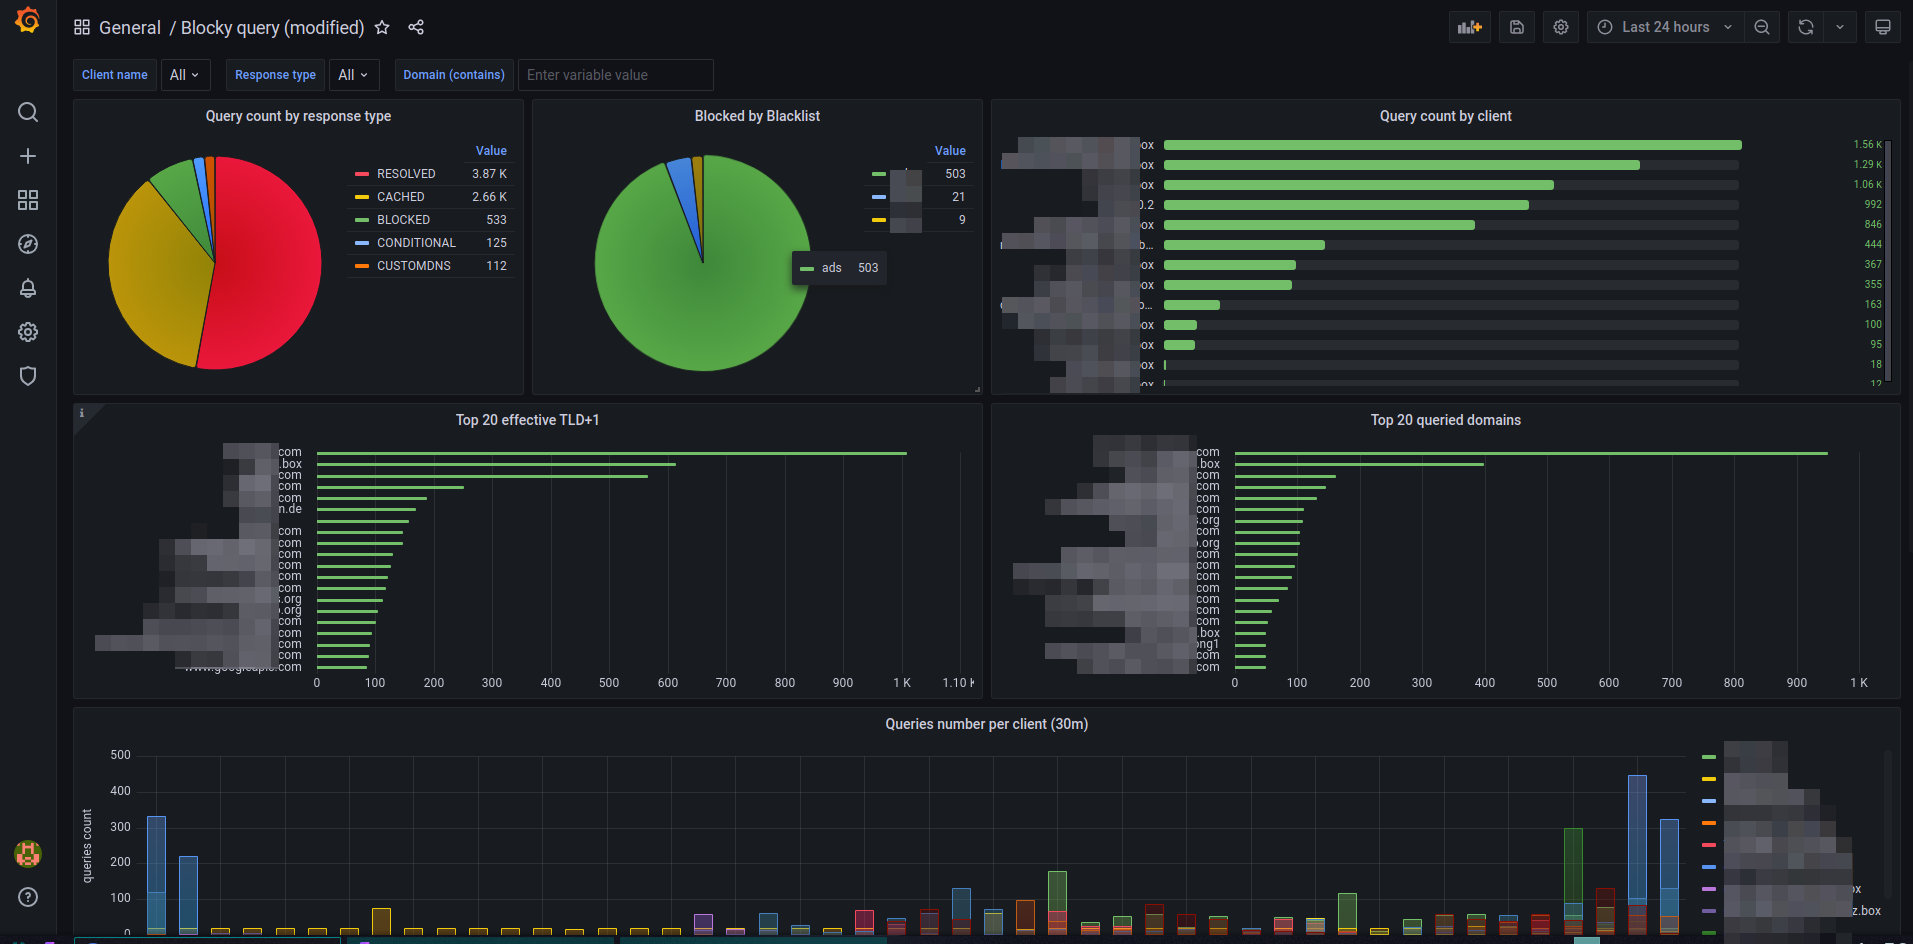 .
.
Please define the MySQL source in Grafana, which points to the database with blocky's log entries.
Postgres
The JSON for a Grafana dashboard equivalent to the MySQL/MariaDB version is located here